As a community owner, you might find the need to understand and report on the frequency that suppliers submit events per supplier, product, and location. This article details the features available in Connect that offer that level of reporting. To understand what is available in Connect for other types of reporting, please see these articles: Customizing and Saving Views and Customizing Reporting in FoodLogiQ Connect.
Managing the movement of product through a supply chain is a big job. It requires data, more data, and even more data! FoodLogiQ provides users a variety of ways to submit event records. Submitted data is used to stitch together the path that specific lots of a product took through the supply chain. With this data in the FoodLogiQ Connect platform, when a food safety or quality issue occurs users can quickly investigate for common lots, trace forward to identify where those lots went, and launch a withdrawal of the affected product - a priceless capability when time is of the essence.

The new Track + Trace reporting feature set can help you take your traceability data to the next level. New reporting can assist you in identifying data gaps in your supply chain to ensure you have the complete event path when necessary.
Analyzing Individual Supplier Participation
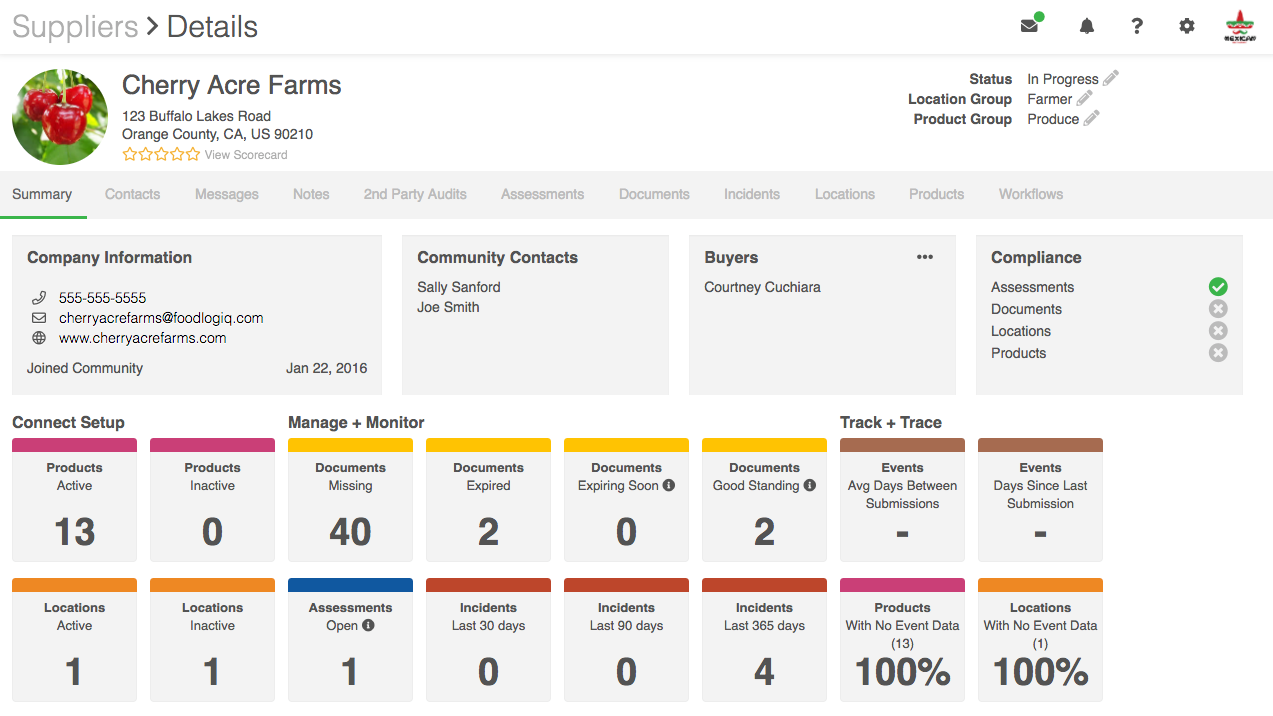
The new supplier summary page lets you at a glance determine if a supplier has stopped sending you event data or if they are sending you incomplete event data. Individual widgets identify if they are missing product or location event data. Knowing this information allows you to strategically and specifically follow-up with each supplier.

Analyze Supplier Participation Across All Suppliers
Managing suppliers is a big job. Now, you can track what percent of products and locations in your network have no data event data. Many of our customers use this metric to track the progress of their traceability initiatives.

Target your efforts by working with suppliers that will have the most impact. Using the Event Submission Regularity: Bottom 10 Suppliers widget, analyze which suppliers are furthest behind on their regular event submission rate.

Want to get even more granular? You can also analyze by location using the Event Submission Regularity: Bottom 10 Locations dashboard widget.

Many of our customers have higher risk products (e.g. perishables or produce). Using the Event Submission Regularity: Bottom 10 Products dashboard widget, you can identify if any of your high risk products are significantly behind on their event submissions, allowing you to focus on the most critical items first.

All of the new dashboard widgets are clickable, allowing users to dive deeper into the full data set where they can sort, filter, and export the underlying data for further analysis.
Columns Available in Suppliers, Products and Locations
In the Suppliers, Products and Locations section, there are five columns available that offer insight into the frequency of supplier submissions:
1. Last Event Submission. This reports the date that Suppliers last submitted Event data into Connect
2. Average Days Between Event Submissions. This reports the average amount of days between Supplier Event data submissions
3. Event Submission Status. This reports the current Supplier Event submission stats in terms of Current, Delayed, Very Delayed, etc.
4. Days Since Last Event Submission. This reports the number of days since the Supplier's last Event data submission
5. Deviation From Average (days). This reports the number of days Suppliers have deviated from their average Event Data submission frequency.
Configuring Columns in Suppliers, Products and Locations
To see these columns in Connect, Click on the appropriate link in the left navigation bar. Once there, click the button on the right side. This will show the column selection pop up. Go to the Track + Trace section to select the desired columns:

The columns will appear on the status page. You can then sort and filter the data, as well as save the view once you configure it the way you want it. For more information on working with columns and views, see this article: Customizing and Saving Views.
