Community Owners have the ability to create, edit, and delete configurable reports to help them identify key metrics and view these results in a pie graph, bar graph, timeline graph or heat map (based on location).
- Creating a New Report
- Saving the Current Graph View
- Interacting with the Graph
- Refreshing, Editing, or Deleting a Graph
- Downloading a Report
Creating a New Report
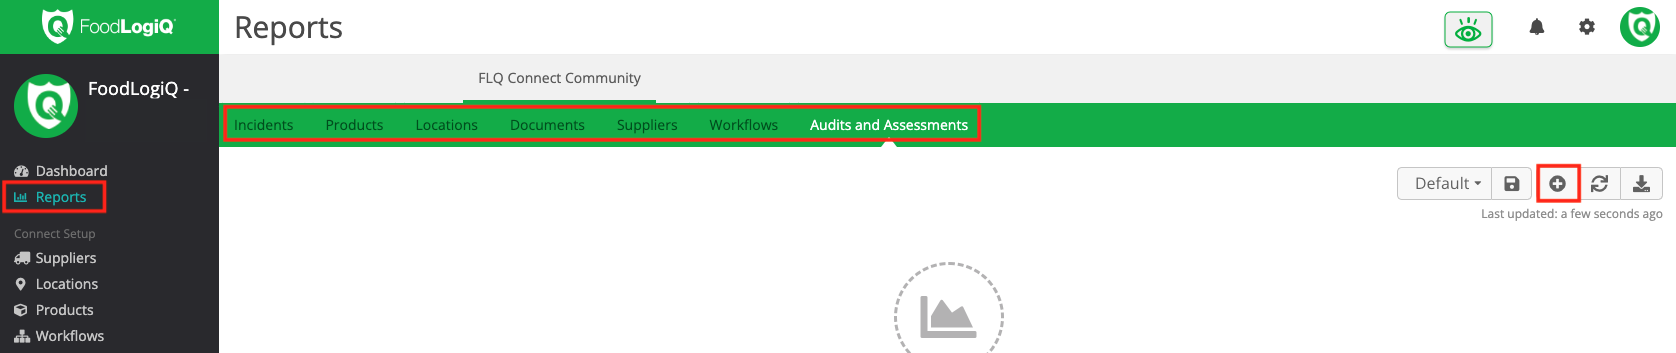
1. Login to your business account within FoodLogiQ Connect (connect.foodlogiq.com).
2. Click on Reports in the left-hand section.
3. Select the area of Connect for which you want to create a report.
4. Click the ![]() button to create a new report.
button to create a new report.
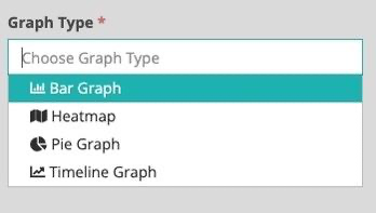
Graph Types
The reports feature currently offers data visualization in 4 different graph types. Users can select to add a:
- Bar Graph
- Heatmap (only for Incidents, Locations, Suppliers)
- Pie Graph
- Timeline Graph
Each area of the reporting feature (Incidents, Products, Locations, Documents, Suppliers, Workflows, Audits & Assessments), and each graph type may require specific information. Outlined below are some of the general form fields that may be required.
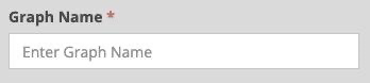
Graph Name
A graph name must be added in order to save the graph to the preview area. The graph name will support both numeric and text entry.
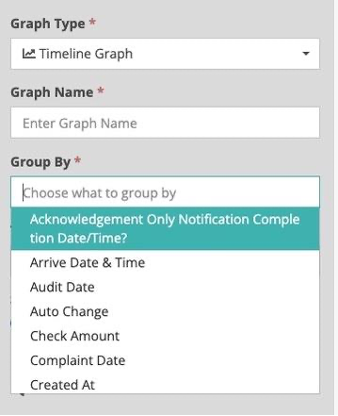
Group By
Dependent upon what graph type and for what area (Incidents, Products, Audits & Assessments, etc.) was chosen, will determine what the user is able to group the graph data by. The screenshot below depicts the available options to Group By for an Incidents Timeline Graph. The shown Group By attributes are any data or date/time custom or default attributes as outlined on the incident templates.
Time Attribute
When creating a timeline graph, the graph can be visualized by a Completed At date or a Created At date.

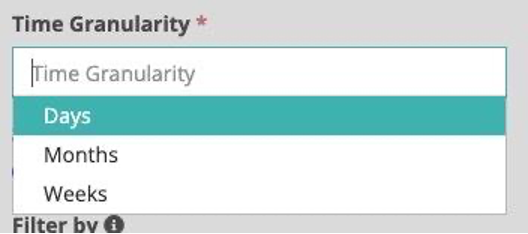
Time Granularity
If creating a timeline graph, each graph can be visualized in different time granularities. The default will be to show time in the aspect of days, but you can choose to view data in months as well as weeks.
Report Use Case
Depending on the graph and graph area, you may be able to select which use case you would like to report on. Currently, we offer the ability to view the average score, or number of responses compared by location, product, question, or supplier.

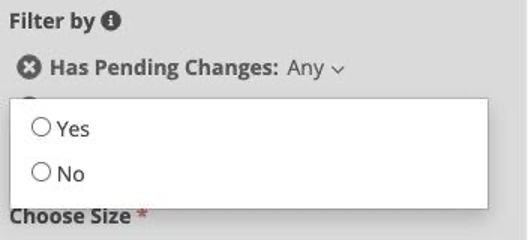
Filter By
Depending on the use case, there may also be the need to add a filter. If selecting to add a filter, the same Standard and Custom Attribute filters will be available. Multiple filters can be selected.
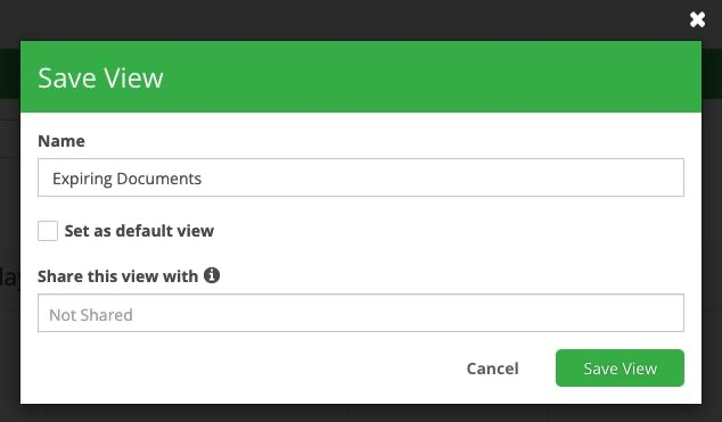
Saving the Current Graph View
After you have created a graph, it might be beneficial to save this view so your graphs are saved. That way, anytime you come back to this page, the graphs will show in the main view. otherwise, they will not be seen and have to be created again.
1. Click on the "Save view as.." icon ![]() in the upper-right section.
in the upper-right section.
2. Name the view.
3. If you want to see this view of graphs first each time you go to this section, then click on the "Set as default view" box.
4. If there is anyone else in your business who would benefit from seeing the graphs, then you can share this view to certain roles.
5. Click the Save View button.
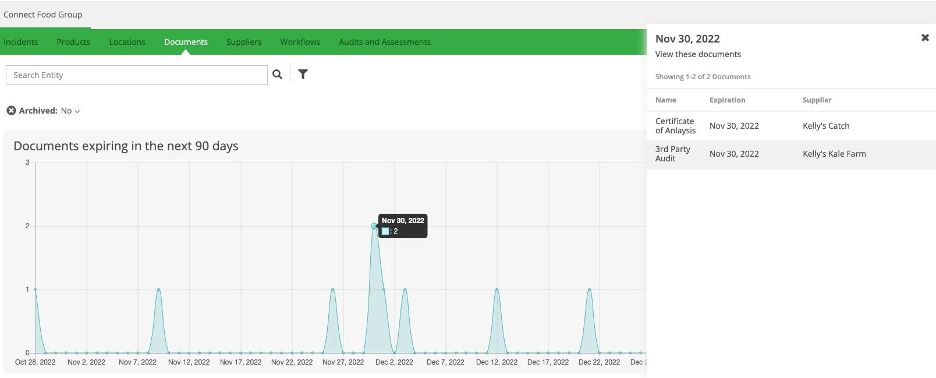
Interacting with the Graph
In-depth information from each graph can be seen by clicking on a section of the graph.
For this example, if a user wanted to view the specific documents with expiration in the next 90 days, they could select a desired data point and view the expiring documents.
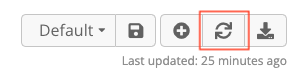
Refreshing, Editing, and Deleting a Graph
As more information is entered, this will be automatically updated in the list view. You can also manually trigger this refresh by selecting the outlined below button on any report area.
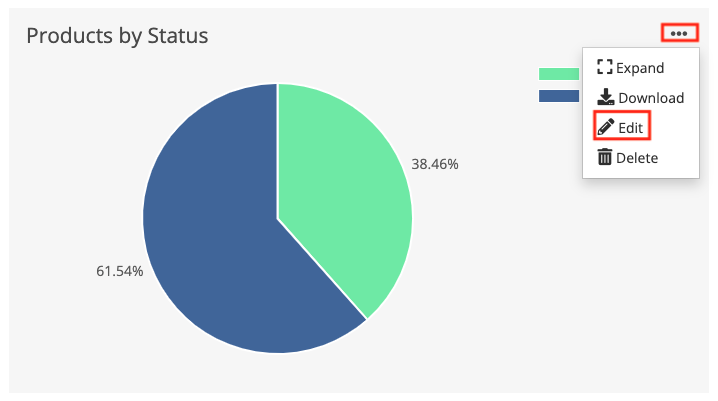
To edit a graph, such as change the graph name or how the data is visualized, click on the three dots on that graph and select Edit. Once you are satisfied with the changes, click the Save button. If you wish to not save the changes, click on the X in the upper-right corner.
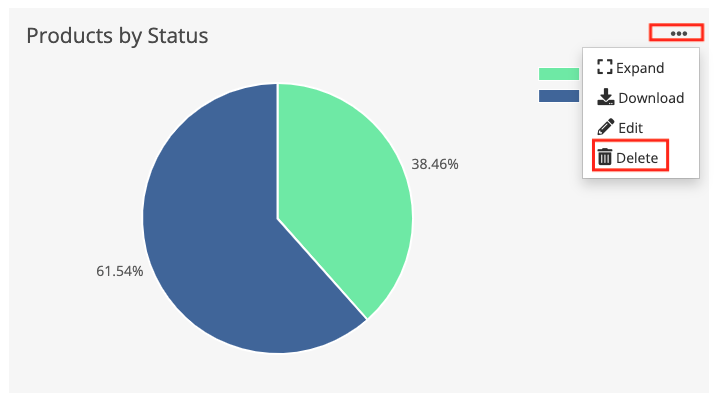
To delete a graph entirely, click on the three dots on that graph and select Delete.
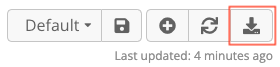
Downloading a Report
The reports you create can be downloaded/exported in two different ways.
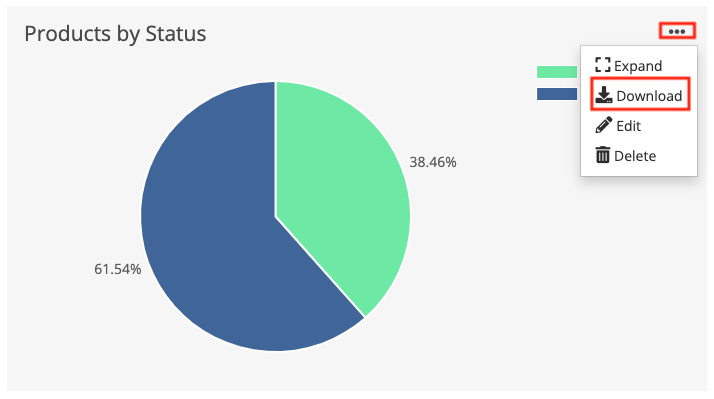
To download an image of one graph, click on the three dots of the specific graph and select Download. This will download a .png file of the one graph.
To download all the graphs, click on the Export button. This will download all of the graphs into .pdf format. This is recommended as the pdf will show you more information than just the .png file.
For more information about creating reports for specific areas of Connect, please visit the link below: